Analyzing Your Angular app JS bundles
How to analyze the JS bundles of your Angular applications and fix bundle size issues

Let’s see how to analyze the JS bundles of your Angular applications.
In this article, I’ll explain how to generate stat files for your Angular application as well as how to analyze those files using webpack-bundle-analyzer. Thanks to this, you’ll be able to quickly discover/understand what contributes the most to your bundle size and know where to put your energy to improve the situation.
Generating stats
To generate bundle stats, we will use webpack-bundle-analyzer. Go ahead and install it now:
npm install [webpack-bundle-analyzer](https://www.npmjs.com/package/webpack-bundle-analyzer) --save-dev
Next, add a script to generate the stats file, assuming that the target project is called “web”:
"webpack-analyzer:analyze:web:prod": "nx run web:build --prod --stats-json",
In this example, the project uses Nrwl NX’s nx run command (which provides a wrapper around NG CLI), but it works all the same with the Angular CLI:
"webpack-analyzer:analyze:web:prod": "ng run web:build:production --stats-json=true --statsJson=true"
As you can see, this script generates stats for the production build. You could do the same for the development version, but you’d get very different (and often irrelevant) results.
Go ahead and execute the script using npm run webpack-analyzer:analyze:web:prod.
Once the build completes, you should find a file called “stats-es2015.json” in the dist folder. In my NX workspace, the file appears under “dist/apps/web/”.
Don’t waste time looking at the file contents as it’s really low level and you won’t be able to achieve much that way.
Visualizing module stats
Once you have generated the stats, you can use a second script to go further, analyze and visualize those.
Again, we’ll do this using webpack-bundle-analyzer:
"webpack-analyzer:web": "webpack-bundle-analyzer dist/apps/web/stats-es2015.json",
Here, you just need to adapt the path to the location of the stats file within your project’s dist folder.
If you execute that script, then the file will be analyzed, and a Web server will be started for you to explore the results of the analysis:
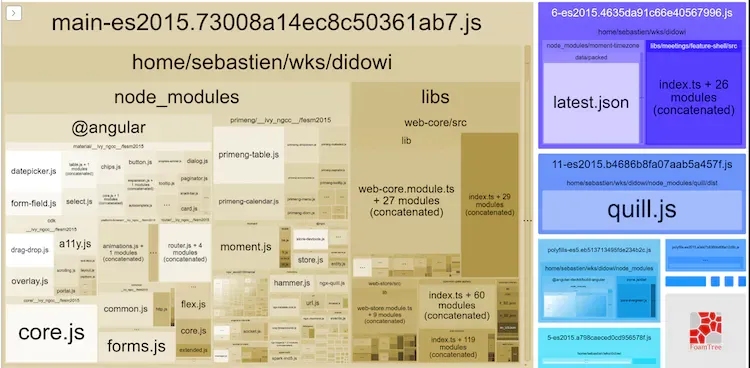
If you access it, then you’ll finally get to the interesting part; the visualization:

It may look like a mess, but this view is actually pretty well organized. You have to look at the map from top to bottom. In this case, on the left we can see the contents of the “main-es2015.….js” bundle, which is indeed the main bundle of the application.
Within that left block, we can see that everything is under the “home/sebastien/wks/didowi” folder. Then, within that, we see that the major part of the bundle size is brought in by modules coming from “node_modules” (about 2/3) and the rest comes from the “libs” folder (i.e., application libraries).
If we look deeper, many modules are included from node_modules, such as Angular, PrimeNG components, Core.js, hammer.js, ngx-quill and tons more.
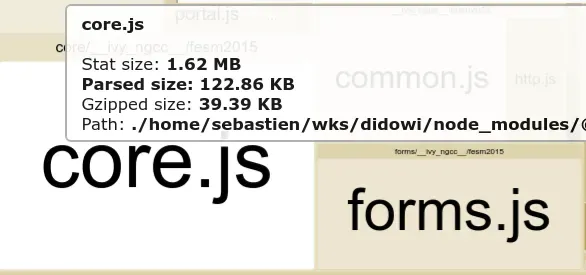
Tip: you can zoom in-out as you wish and hover elements to see how much they contribute to the size of the bundle:

In the screenshot above, you can see that the “core.js” file contributes ~40KB (gzipped) to the size of the bundle. It’s pretty obvious that something can be done to reduce the bundle size here: look at how to only include relevant parts of core.js instead of bringing the whole thing in…
The nice thing is that you can quickly notice which modules contribute most to the bundle size and focus on those first to quickly improve your application.
In this example, moment.js is also part of the project. Moment is notoriously problematic for bundle size as all the locales are included by default. Here, you can see that the project only includes the relevant locales:

I’ll publish another article explaining how to do this for moment.js. Note that other libraries are more in line with modern module systems and allow (just like RxJS) to pick the bits and pieces that you really need.
Conclusion
In this small piece, I’ve shown you how to easily get a sense of what contributes the most weight to the production bundles of your Angular applications.
webpack-bundle-analyzer, is a super useful tool to discover issues with bundling and to help you quickly figure out what to focus on in order to improve the situation.
That's it for today! ✨
About Sébastien
I am Sébastien Dubois. You can follow me on X 🐦 and on BlueSky 🦋.
I am an author, founder, and coach. I write books and articles about Knowledge Work, Personal Knowledge Management, Note-taking, Lifelong Learning, Personal Organization, and Zen Productivity. I also craft lovely digital products . You can learn more about my projects here.
If you want to follow my work, then become a member.
Ready to get to the next level?
To embark on your Knowledge Management journey, consider investing in resources that will equip you with the tools and strategies you need. Check out the Obsidian Starter Kit and the accompanying video course. It will give you a rock-solid starting point for your note-taking and Knowledge Management efforts.
If you want to take a more holistic approach, then the Knowledge Worker Kit is for you. It covers PKM, but expands into productivity, personal organization, project/task management, and more:
If you are in a hurry, then do not hesitate to book a coaching session with me:


